I get frustrated when people criticize the practice of audio measurement without having examined the issue in any depth -- but with headphones, I can forgive. The measurements for most audio products, such as speakers and amplifiers, are well established and easy to grasp. Even in high school, when I barely knew a capacitor from a choke, I could understand most of the measurements Julian Hirsch published in Stereo Review. But headphone measurements are nowhere near as intuitive -- a problem I hope to solve with this article.
The problem comes from the fact that headphones and earphones exclude some or all of the acoustical effects of the earlobe and ear canal. Your brain automatically compensates for these effects, and also uses them to help determine the direction of arrival of sounds. It’s kind of like an EQ curve that your brain applies to the sound -- but your brain still applies that EQ curve even when your headphones or earphones partially or totally eliminate the effects of the earlobe and ear canal. So the headphones or earphones have to compensate for that, effectively applying a reverse EQ curve that (to some degree, at least) tricks your brain into thinking you’re hearing speakers in a room.
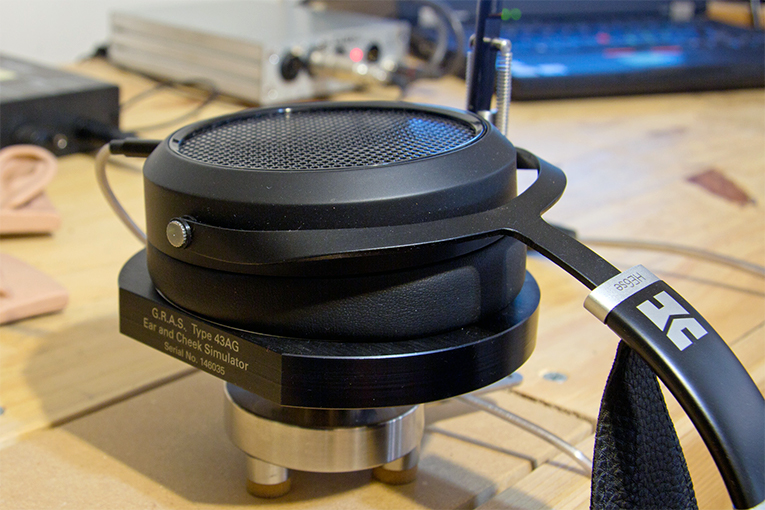
Complicating matters is that in order to get meaningful measurements of headphones, we have to test them in a way that mimics the way they’re actually used -- which means using a HATS (head and torso simulator) or an ear-cheek simulator, both of which have their own acoustical effects. Some engineers dispute the utility of these simulators, preferring to use simpler means of coupling a measurement microphone to the headphone or earphone. But having tried it both ways, I find the simulators produce far more meaningful and useful measurements, in part because they can be compared with other people’s measurements.
Further complicating matters is that the standards for headphone measurement were established decades ago, and were designed primarily for evaluation of hearing aids, not headphones. We also have only a modest amount of contemporary scientific research on headphones we can refer to in order to find out what measured characteristics listeners prefer in headphones (see the comments section for more discussion of this topic) -- mostly the research done by Harman International, which you can read about on the personal blog of Sean Olive, a senior researcher at Harman. Harman’s research gives us a good idea of the measured headphone response that most people prefer, which corresponds with the in-room response of a well-engineered loudspeaker measured at the eardrum.
But I could go on and on about headphone acoustics and research. Let’s move into explanations of the charts we present on SoundStage! Solo.
Frequency response
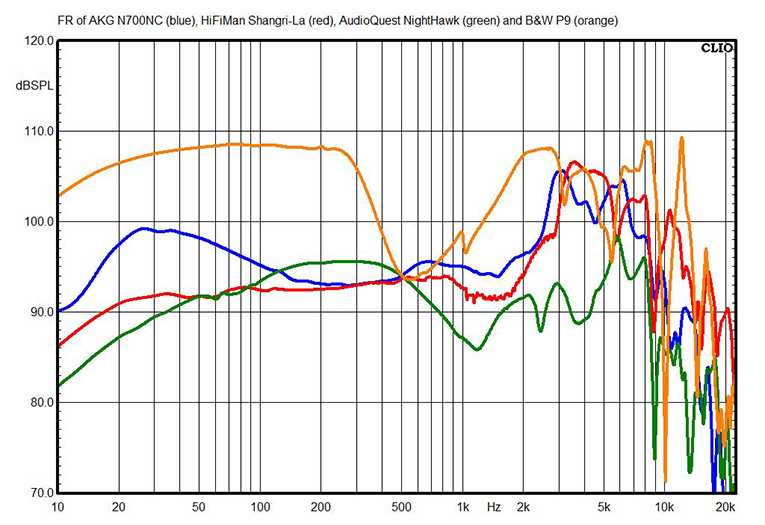
The frequency response chart shown above is, by far, the most important measurement. It’s also the most difficult to interpret. It tells you how evenly a headphone reproduces signals of the same level, but at different frequencies. With a speaker (measured on-axis) or amplifier, this line should be flat. But a headphone that produces a flat measurement on an ear-cheek simulator will likely sound dull.
According to the so-called “Harman curve” (and these are all approximate numbers), relative to a baseline at 400Hz, over-ear or on-ear headphones’ bass should be boosted by 5dB at 20Hz and 3dB at 100Hz, and there should be a 1.5-octave-wide boost (measured at the -3dB point) of 10dB centered at 3.2kHz. For earphones, the Harman curve is basically the same but with the bass boosted an additional 4dB. Harman’s research shows that these characteristics will produce a headphone response that most listeners consider the most natural sounding.
The AKG N700NC headphones measurement I show here (blue trace) is close to the Harman curve, while the HiFiMan Shangri-La headphones (red trace) clearly have slightly elevated treble and reduced bass, and the AudioQuest NightHawks (green trace) obviously have attenuated treble. Meanwhile, the B&W P9s (orange trace) are wildly anomalous. (Note that my frequency-response measurements are all referenced to 94dB at 500Hz, as per the IEC 60268-7 standard.)
You might like or dislike any of these headphones, but it’s useful to have some sort of baseline, and that’s where the Harman curve serves us well. If a set of headphones deviates from this baseline by a couple of dB here or there, it’s probably no big deal -- whether you consider the effects positive or negative is something you’ll have to judge for yourself. But if a set of headphones strays 3 or more dB from this baseline in multiple places, you know they will sound considerably different from the norm, and will color the sound in an unnatural way.
It’s important to note here that an audio product with rolled-off bass can be made to sound subjectively flat (i.e., neutral) by rolling off the treble, and, accordingly, a product with boosted bass can be made to sound flat by boosting the treble. This explains why headphones that measure somewhat flatter than the Harman curve, or that have somewhat greater peaks in the bass and treble, might still sound fairly flat to a reviewer or a listening panel. But of course, if the bass and treble peaks are too extreme (or modest), the midrange will at some point be obscured (or emphasized), and the headphones will sound unnatural.
I’ve often included headphones or earphones that are close to the Harman curve in my comparison charts, and plan to do more of that going forward.
Spectral decay
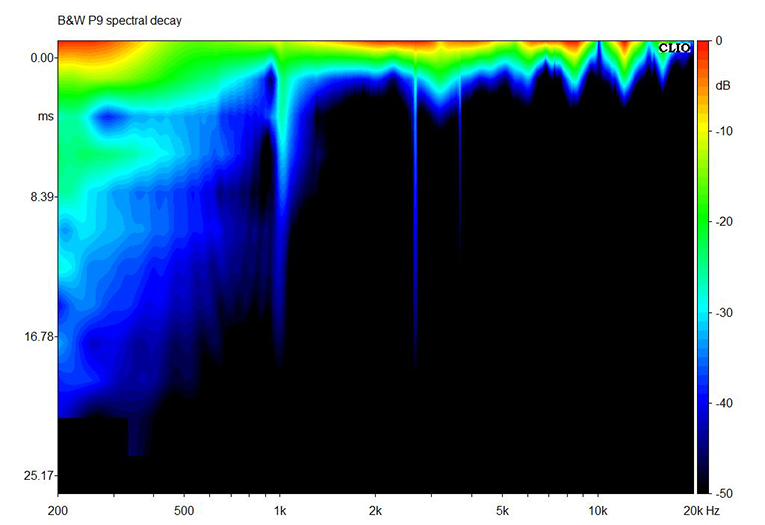
A friend of mine who has decades of experience in speaker measurement once joked of spectral decay measurements, “I’m not sure how important they are, but they do look pretty!” Of course, we know that these measurements identify resonances in a speaker or headphone. A spectral decay (sometimes called “waterfall”) measurement is essentially a frequency response measurement repeated within a certain time window (in this case, 25ms). Ideally, what you would see here are thin horizontal lines at the very top of the chart, following the color spectrum from red to green to blue, and the bottom 95% of the chart would be black. Any deviation from that -- the continuation of certain colors as you move down on the graph -- indicates a resonance.
Our understanding of how these beautifully colored streaks correspond with listener preferences in headphones isn’t strong, in part because so few headphones have serious resonances. Unlike speakers, which are usually made from large panels of wood that can vibrate, there’s not much in headphones (outside of the drivers) that’s large or compliant enough to produce a resonance within the audioband.
The further down one of the colored streaks extends from the baseline at the top, the longer the resonance lasts. The color of the resonance indicates its magnitude, and you can see the color scale on the right side of the chart. So the stronger the resonance, and the longer it lasts, the more you’re likely to hear it -- and you’ll hear an emphasis of the frequencies within the resonance band.
Once in a while, I do see headphones with a lot of resonance in the bass, which indicates they may sound boomy. I also occasionally see strong resonances around 3kHz, which correspond with the response peak described in the previous section; the stronger the peak, the more it’ll resonate, but I’m not sure this is a real problem, because as we saw above, emphasis of this frequency range is necessary for good sound in headphones.
With many open-back headphones, I see a lot of low-magnitude (-40dB or weaker) “hash” in the region between about 1 and 5kHz. I’m not certain why this happens, although one scientist I know suggested it’s caused by sound bouncing back and forth between the ear-cheek simulator and the driver diaphragm, and with no chamber behind the driver, there’s little or nothing to damp these reflections. (I had thought the hash is reflections of the headphones’ sound in the room coming back through the diaphragm, but placing 4" of recycled denim insulation -- an excellent sound absorber -- on the back of the headphones didn’t reduce the hash.) I speculate that this wouldn’t occur as much with a real cheek and ear, which wouldn’t be as reflective, and that this “hash” might have the subjective effect of making the sound of these headphones seem more spacious and open.
Distortion
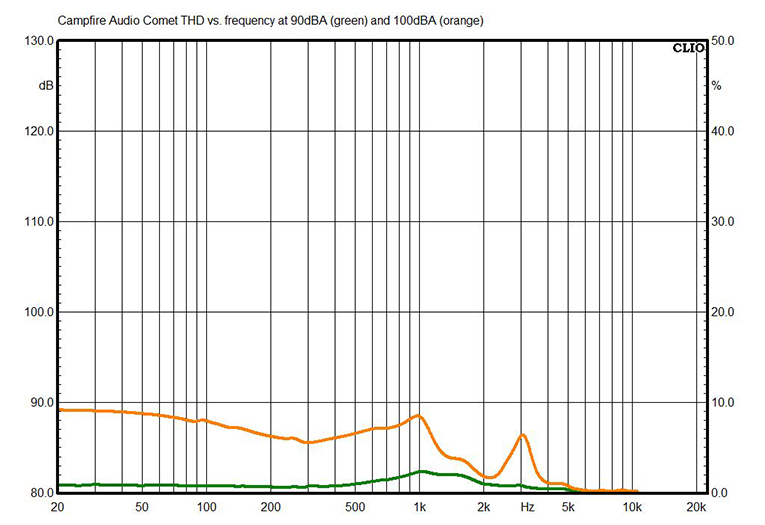
The chart above shows how the total harmonic distortion (THD) of a headphone varies with frequency, and at two different levels. Both of these levels are loud; 90dBA (measured with pink noise from my Clio 10 FW audio analyzer) is about as loud as I can stand to listen, while 100dBA is really louder than anyone should listen. But I’ve found these two levels are what “separate the men from the boys” in headphones, so to speak. Pretty much any headphones can play at 80dBA with no significant distortion. If headphones start to distort (usually in the bass) at levels above about 5% at 90dBA, you’ll probably notice that at loud levels. If they distort noticeably at only 100dBA, which is uncomfortably loud anyway, I don’t hold it much against them -- but if they don’t distort at 100dBA, which many headphones do not, then I give them extra credit for having robust drivers.
It’s important to remember here that while 0.5% THD is a commonly accepted threshold of audible amplifier distortion at 1kHz, the commonly accepted threshold for subwoofer distortion audibility is 10% THD. So if a headphone has 5% THD at 50Hz, it’s probably not a big deal.
The importance of harmonic distortion in headphones is usually vastly overstated. As you can derive from looking at my distortion charts, distortion normally becomes significant only at loud levels. At normal listening levels, it’s almost always insignificant because it’s occurring at levels perhaps 60dB below the material you’re listening to -- the equivalent of someone lightly whispering from a few feet away when your stereo is cranked.
In “The Correlation Between Distortion Audibility and Listener Preference in Headphones,” a 2014 Audio Engineering Society paper by Steve Temme, Sean Olive, Steve Tatarunis, Todd Welti, and Elisabeth McMullin, the researchers found that while listeners did single out one pair of headphones from the five tested as having excessive distortion, “The results from the listening tests indicated that listeners had difficulty reliably discriminating among the different headphones even though the distortion measurements indicated there were quantitative differences among them in terms of measured THD, IMD [intermodulation distortion], multitone and non-coherent distortion measured with music.”
I’ve had years of experience comparing the results of these measurements to subjective perceptions of the distortion headphones produce, and I’ll always let you know if my measurements indicate a potentially audible problem.
Isolation
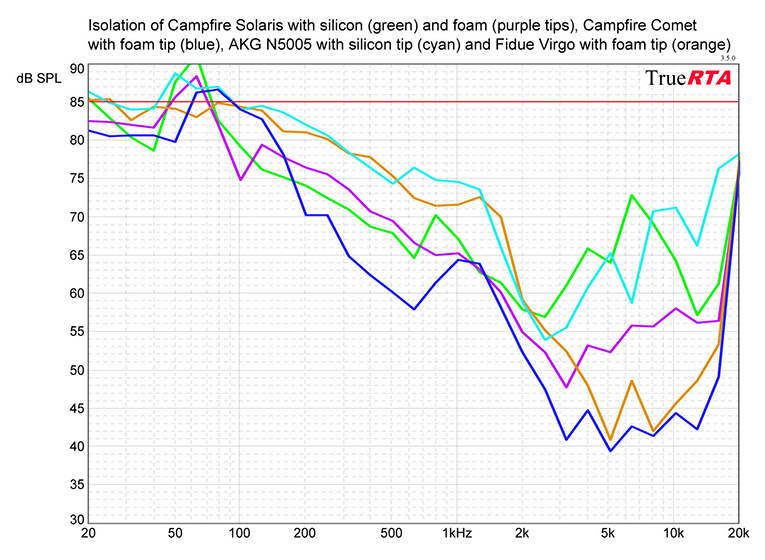
Isolation indicates how well a set of headphones blocks outside sound. The red line you see near the top of the chart represents the 85dB baseline for the measurement (that’s pink noise played at 85dBC). The lower the trace appears on the chart, the better the headphones are at blocking the sounds of the environment around you. That’s generally a good thing, because you’ll hear more music and less noise, and you’ll probably be able to listen comfortably at a somewhat lower level.
The only possible exception is with open-back headphones, which aren’t designed to block outside sound. I’ve found that sometimes the worse my isolation measurement is for a set of open-back headphones, the more spacious their sound. That’s because the driver confronts less acoustical impedance -- i.e., there’s less physical structure on either side of the driver to block its sound. It may also indicate that the driver’s mass is lower, which should give it a more detailed and subtle sound with better high-frequency extension.
For more discussion of this topic, see my article “How Much Noise Do Your Headphones Really Block?”
Impedance
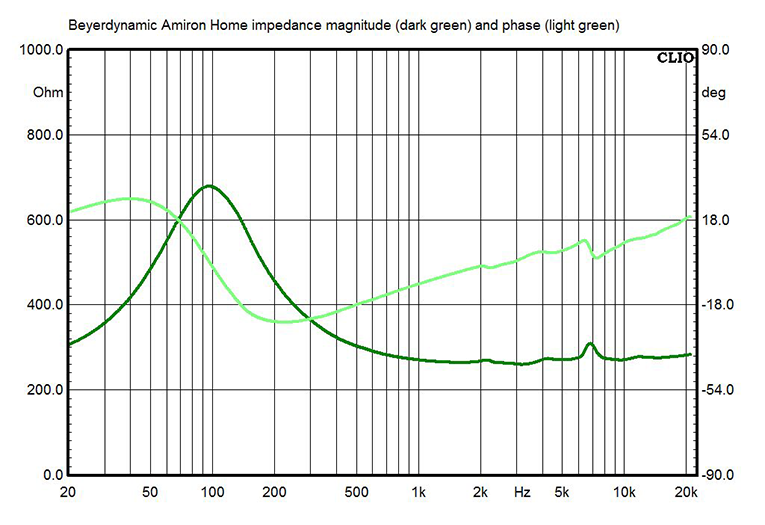
This chart shows the impedance -- or effectively, the AC resistance -- of the headphones. Impedance doesn’t directly impact the sound, but it does give you an idea of how difficult the headphones may be to drive. Any headphones with an average impedance much above about 100 ohms may require more voltage to reach loud listening levels than some smartphones and inexpensive portable music players can provide. While most headphones have an average impedance in the mid-double-digits, a few audiophile models do have higher impedances, typically 250 to 600 ohms. While I’ve noted a perception among a few headphone enthusiasts that “higher is better” when it comes to impedance, that hasn’t been my experience -- the results of listening panels I’ve conducted do not support this conclusion, and I have found no published controlled listening tests that have been performed in this area.
If the headphones’ impedance curve shows a large peak, then the response in the frequency range surrounding that peak is likely to change somewhat when you switch from a source with relatively low output impedance (say, 1 to 5 ohms) to a higher-impedance source (75 to 100 ohms). This is most common with earphones using balanced-armature drivers, and also with some large headphones using dynamic drivers.
Below the impedance chart, I always cite the headphones’ sensitivity -- the average output between 300Hz and 3kHz, measured with a 1mW signal calculated for the headphones’ rated impedance. (To get the signal strength I used for this measurement in volts, multiply the rated impedance by 0.001, then calculate the square root of the result.) Sensitivity tells you little about the sound quality of headphones, but it does indicate how much power the headphones need to reach a loud listening level. Headphones with measured sensitivity above about 97dB should play loud enough from just about any smartphone, tablet, or music player. Headphones measuring about 88 to 97dB will need some sort of external amp or a high-quality portable music player to deliver satisfying volume, while headphones with measured sensitivity below about 88dB will need a powerful amp (at least 300mW into 32 ohms, I’d estimate) to drive them properly.
I hope this makes the headphone measurements on SoundStage! Solo more useful to our readers. If you have any questions, drop me a line and I’ll do my best to answer them.
. . . Brent Butterworth